
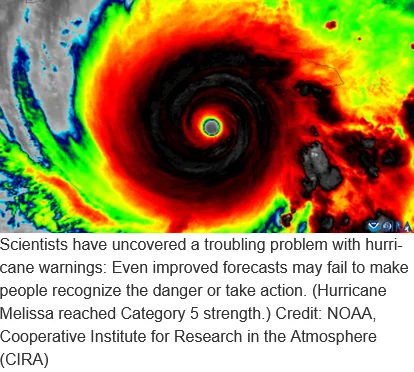
The challenge of translating complex meteorological data into actionable public safety directives has long been a focal point for emergency management agencies. While the National Hurricane Center (NHC) continues to refine its visual communication strategies, a new study from Florida State University (FSU) suggests that even the most well-intentioned updates to hurricane forecasting graphics may fall short of influencing public behavior. Despite improvements in how maps display inland threats, the research indicates that citizens remain prone to significant misconceptions about the "cone of uncertainty," creating a persistent disconnect between scientific data and disaster preparedness.
The study, published in the American Meteorological Society journal Weather, Climate, and Society, evaluated an experimental graphic introduced by the NHC in 2024. This revised model sought to address a long-standing criticism of the traditional "cone" map: that it disproportionately emphasizes coastal threats while obscuring the lethal potential of storm conditions as they move inland.
The Evolution of the Hurricane Cone
For decades, the "cone of uncertainty"—the white, fan-shaped graphic that projects a storm’s probable track—has served as the signature image of hurricane coverage. However, meteorologists have long recognized that the graphic is frequently misunderstood by the general public. While the cone represents the probable track of the center of the storm, it says nothing about the physical size of the cyclone or the scope of its wind and rain fields.
Historically, the cone has focused heavily on the path of the eye, often leaving residents in inland regions—who face extreme risks from flooding, wind damage, and tornadoes—to underestimate their vulnerability. The 2024 experimental graphic attempted to bridge this gap by incorporating tropical storm and hurricane watches and warnings for inland areas directly into the map’s display.
Methodology and Research Findings
The FSU research team, led by Assistant Professor Elizabeth Ray and co-authored by Assistant Professor of Geography Bradford Johnson, conducted a controlled study involving residents from Florida and Georgia. By presenting participants with both the conventional cone graphic and the experimental version, the researchers aimed to quantify whether the added information regarding inland watches and warnings would translate into higher levels of situational awareness.
The results were nuanced. While participants viewing the experimental graphic were demonstrably better at identifying inland areas under official watches, this cognitive improvement did not translate into a behavioral shift. The study found that even when individuals could correctly identify their location within a warning zone, their perceived level of danger did not increase, nor did their stated intention to engage in protective measures, such as boarding up windows or planning an evacuation.
Furthermore, the study reaffirmed the persistence of a fundamental misunderstanding: the "size fallacy." Despite years of educational campaigns, many survey participants continued to interpret the width of the cone as a proxy for the size of the storm itself. When the cone is wide, respondents often assume the storm is massive; when it is narrow, they mistakenly perceive the storm as small or less threatening, regardless of the storm’s actual wind field or moisture content.
A Chronology of Communication Challenges
The struggle to communicate storm risk has evolved alongside the technology used to track hurricanes.
- 1990s: The NHC began using the "cone of uncertainty" as a standard forecasting tool to communicate the range of possible tracks.
- 2005: Following the devastation of Hurricane Katrina, emergency managers noted that public focus was too often fixated on the center line of the cone, ignoring the catastrophic impacts occurring far outside the predicted path.
- 2010s: The NHC introduced supplemental graphics, such as storm surge inundation maps and wind speed probability maps, to move the conversation away from the cone.
- 2024: The NHC released the experimental graphic evaluated in the FSU study, specifically designed to visualize inland hazards.
- 2026: The FSU findings highlight that despite these visual advancements, the human element of risk perception remains resistant to graphical changes.
The Behavioral Gap in Disaster Preparedness
The FSU findings underscore a significant "behavioral gap" in meteorology. In crisis communication, there is a distinct difference between "knowledge" and "action." An individual may possess the knowledge that they are in a watch area, but that knowledge does not always trigger a survival instinct if the individual does not believe the event will personally affect them.
"The National Hurricane Center has made a number of thoughtful changes to improve how hurricane information is communicated," Assistant Professor Elizabeth Ray noted. "We had a simple question: Do those changes actually help people understand what the graphic is telling them about the risk they face?"
The research suggests that for many, the answer is no. The graphic, while technically more accurate, does not overcome the psychological barriers of "optimism bias," where individuals believe they are less at risk than their neighbors, or the "normalcy bias," where people underestimate the probability and impact of a disaster.
Implications for Emergency Management
The findings carry profound implications for how local, state, and federal agencies should conduct public outreach. If a map alone cannot convince a resident to evacuate or secure their home, the reliance on graphical communication may be reaching a point of diminishing returns.
Meteorological experts suggest a multi-layered approach to risk communication. The FSU team recommends that the cone should never be the sole source of information for the public. Instead, it must be paired with hyper-local, context-specific alerts. For example, a map showing a storm track is less effective than a text-based alert that states: "Expect 10 inches of rain and flooding in your specific neighborhood by Tuesday."
"Our findings are a reminder that one graphic can only tell you part of the story," Ray said. "Don’t rely on the cone alone. Pair it with clear, local information about what impacts to expect and what actions to take. That gives you a fuller picture of what the storm could mean where you live and what to do next."
Broader Scientific Context and Data
The difficulty of interpreting hurricane forecasts is not a localized issue. Data from the National Oceanic and Atmospheric Administration (NOAA) consistently shows that while forecast accuracy for track and intensity has improved by approximately 50% over the last two decades, the mortality rate associated with inland flooding—often caused by storms that have weakened from hurricane status—remains high.
The FSU study suggests that the "cone of uncertainty" has become a cultural icon that is perhaps too deeply ingrained for minor tweaks to fix. The persistent misunderstanding of the cone as a representation of storm size—rather than a measure of track uncertainty—is a psychological hurdle that graphic design alone may not be able to clear. As climate change increases the intensity and the inland reach of tropical systems, this gap between technical forecasting and public interpretation becomes a matter of life and death.
Future Directions in Risk Communication
Looking forward, the research suggests a need for "decision-support" communication rather than just "information-provision" communication. This means shifting from maps that show where a storm is going to maps that show what the storm will do to the viewer’s specific environment.
The collaboration between the FSU research team and the NHC, which supplied the experimental graphics for the study, highlights a constructive relationship between academia and government agencies. By identifying where communication fails, researchers hope to guide the NHC in developing future iterations of their forecast products that move beyond the limitations of the cone.
Ultimately, the study serves as a sobering reminder that technology is only as effective as the public’s ability to interpret it. While the NHC continues to iterate on its graphical products, the burden of preparedness still rests on a combination of effective government communication and individual accountability. The path forward for hurricane safety likely lies in reducing the reliance on single-image graphics and increasing the use of personalized, impact-based messaging that explicitly tells residents not just where the storm is, but what they must do to survive it.