The National Oceanic and Atmospheric Administration (NOAA) has officially announced a milestone in national emergency preparedness: the expansion of its Flood Inundation Mapping (FIM) tool to cover the entirety of the United States. This digital infrastructure, managed by the National Weather Service (NWS) and its Office of Water Prediction (OWP), represents a significant leap forward in how the federal government communicates the dangers of rising water levels. By transitioning from the previous coverage of 60 percent to a comprehensive 100 percent of the contiguous United States, Hawaii, and major U.S. territories, the agency has effectively removed the "data deserts" that previously left millions of residents vulnerable to unforeseen riverine flooding.
The Evolution of Predictive Hydrology
For decades, flood warnings were primarily delivered in the form of river gauges and crest height predictions. While useful for hydrologists, these metrics often failed to translate into actionable information for the average citizen. A homeowner might hear that a river is expected to crest at 22 feet, but that number lacks the context of which streets, basements, or critical infrastructure will actually be submerged.
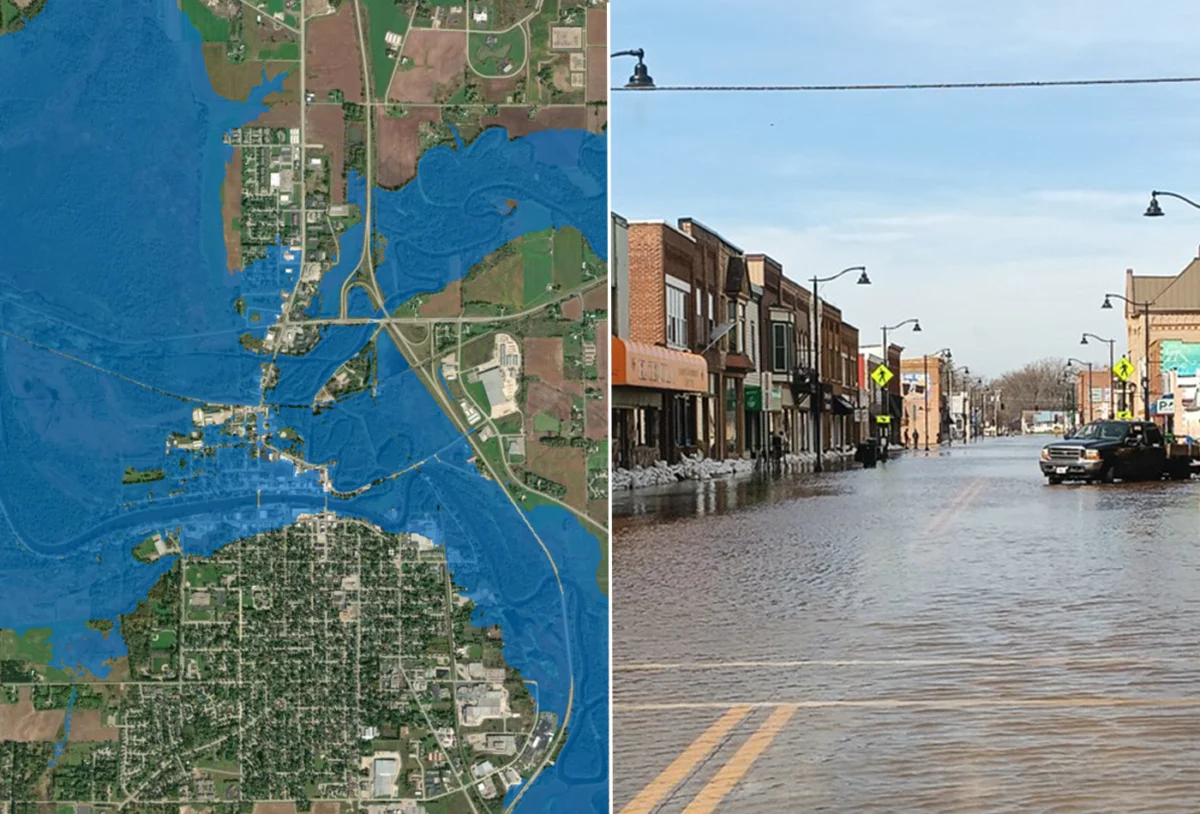
The FIM tool bridges this gap by overlaying model-forecasted river flows onto high-resolution topographic data. By simulating how water moves across a specific landscape, the tool produces real-time maps that delineate exactly which areas are at risk of being covered by water. This shift from one-dimensional measurements to two-dimensional spatial visualization marks a paradigm shift in how the NWS manages hydraulic risk.
The rollout of this technology has been rapid and aggressive. The program was first introduced in 2023, initially covering only 10 percent of the U.S. population. By 2025, that figure had climbed to 60 percent as the NWS refined its hydrological models and processed vast swaths of elevation data. The leap to nearly 100 percent coverage in such a short timeframe underscores the prioritization of water-related hazards within NOAA’s broader mission to protect life and property.
Geographic Scope and Remaining Gaps
The most recent expansion phase has filled critical voids in the nation’s hazard monitoring portfolio. Previously underserved regions—including parts of the southeastern U.S. coast, the Great Lakes basin, the entirety of the New England corridor, the complex terrain of the Rocky Mountains, and the agricultural expanses of the Dakotas and western Nebraska—are now integrated into the system.
However, the NWS has been transparent about the current technical limitations of the project. While the coverage is near-total, it does not yet encompass the extreme northern and western portions of Alaska, nor does it include the specific regional models required for Guam, the Northern Mariana Islands, and American Samoa. According to the OWP, these areas present unique challenges due to sparse sensor networks and complex, localized bathymetry that requires more intensive site-specific modeling than the standardized approach used for the continental United States.
Implications for Emergency Management and Public Safety
The impact of this tool on emergency management cannot be overstated. For first responders, the ability to visualize the "flood footprint" hours or even days before the peak flow arrives allows for more precise staging of rescue equipment and more informed evacuation orders.
National Weather Service Director Ken Graham has been a vocal proponent of the technology, noting that FIM serves as a "game changer" when briefing local officials. During a flood event, time is the most valuable commodity. Instead of spending hours debating whether a specific neighborhood is in the path of a rising stream, emergency managers can now pull up the FIM dashboard to see the projected impact in real-time. This reduces the "wait and see" approach that has historically led to delayed evacuations and preventable casualties.
Furthermore, the data is not restricted to internal government use. The maps are publicly available through the National Water Prediction Service website and are compatible with various Geographic Information System (GIS) applications. This open-access policy allows local municipalities, urban planners, and private citizens to integrate flood risk into their own long-term decision-making, such as zoning regulations, infrastructure maintenance, and flood insurance considerations.
Technical Foundations of the Mapping System
The FIM tool relies on a sophisticated "handbook" of inundation scenarios. Rather than running a brand-new calculation from scratch every time it rains, the system draws from a library of pre-calculated flood scenarios based on different river stages. When a forecast suggests a specific water level, the system immediately pulls the corresponding map from its repository.
For the Lower 48 states, the system provides four distinct versions of inundation mapping that cater to different user needs, ranging from static snapshots to dynamic, evolving forecasts. In Hawaii, Puerto Rico, and the U.S. Virgin Islands, the OWP has implemented specialized services tailored to the unique tropical storm patterns and mountainous flash-flooding risks inherent to those environments.
This technical backbone is supported by the Office of Water Prediction, which serves as the central hub for the NWS’s water-related initiatives. By integrating data from the U.S. Geological Survey (USGS) river gauges, satellite imagery, and meteorological models, the OWP creates a holistic view of the nation’s water cycle.
Economic and Societal Impact
Flooding remains the deadliest and most costly weather-related disaster in the United States. According to historical data from the National Centers for Environmental Information (NCEI), flooding events account for billions of dollars in property damage annually. By providing granular data, the FIM tool has the potential to mitigate these costs by fostering better-informed development and more efficient resource allocation.
The tool also serves as a critical education piece for the public. When residents can see their own neighborhoods highlighted on a flood map, the abstract threat of a "100-year flood" becomes a tangible reality. This visual feedback loop is known to increase public compliance with safety instructions, such as staying off flooded roads—a common cause of flood-related fatalities.
Looking Toward the Future
As NOAA moves past the 100 percent coverage milestone, the next phase of the project will focus on refinement and increased resolution. The current models are effective at a regional and neighborhood scale, but as computational power and machine learning techniques improve, the NWS intends to transition toward even more localized "street-level" granularity.
The expansion of FIM is part of a broader "Weather-Ready Nation" initiative. This federal campaign seeks to build community resilience in the face of increasing climate volatility. As atmospheric conditions shift and weather patterns become more extreme, the ability to predict the physical movement of water will become an essential component of urban and rural resilience alike.
While the FIM tool is an extraordinary advancement, officials warn that it is not a panacea. Residents are still encouraged to heed warnings from local authorities, monitor local river gauges, and remain aware of flash flooding, which can occur in areas not covered by riverine flood models. The tool is designed to supplement, not replace, the vigilance of the public and the expertise of local emergency management agencies.
In summary, the reach of the Flood Inundation Mapping tool to the entire continental United States marks the end of an era where flood risk was an abstract, generalized estimate. It provides a level of transparency and detail that empowers individuals to take charge of their own safety, while providing professionals with the evidence-based tools necessary to save lives when disaster strikes. As the system continues to evolve, it will undoubtedly remain a cornerstone of the nation’s climate adaptation strategy for years to come.