The National Oceanic and Atmospheric Administration’s (NOAA) National Weather Service (NWS) has officially reached a historic milestone in meteorological technology, announcing the expansion of its Flood Inundation Mapping (FIM) tool to encompass 100 percent of the United States. This digital infrastructure, which provides high-resolution visualizations of potential flooding, represents a significant leap forward in the nation’s ability to communicate hydrological risks to the public, emergency responders, and local officials. By moving beyond traditional point-based forecasts—which often only provided river crest heights at specific gauging stations—the NWS is now providing a comprehensive, neighborhood-scale view of water movement across 3.3 million river miles.
The Evolution of Flood Prediction
For decades, flood warnings were primarily delivered in numerical terms: a river would be predicted to crest at a specific elevation, such as 22.5 feet. While this data was vital for hydrologists, it often failed to convey the visceral reality of how that water would manifest on the ground. A resident living a mile from a river might not understand if that crest height meant their basement would flood or if their primary evacuation route would be severed.
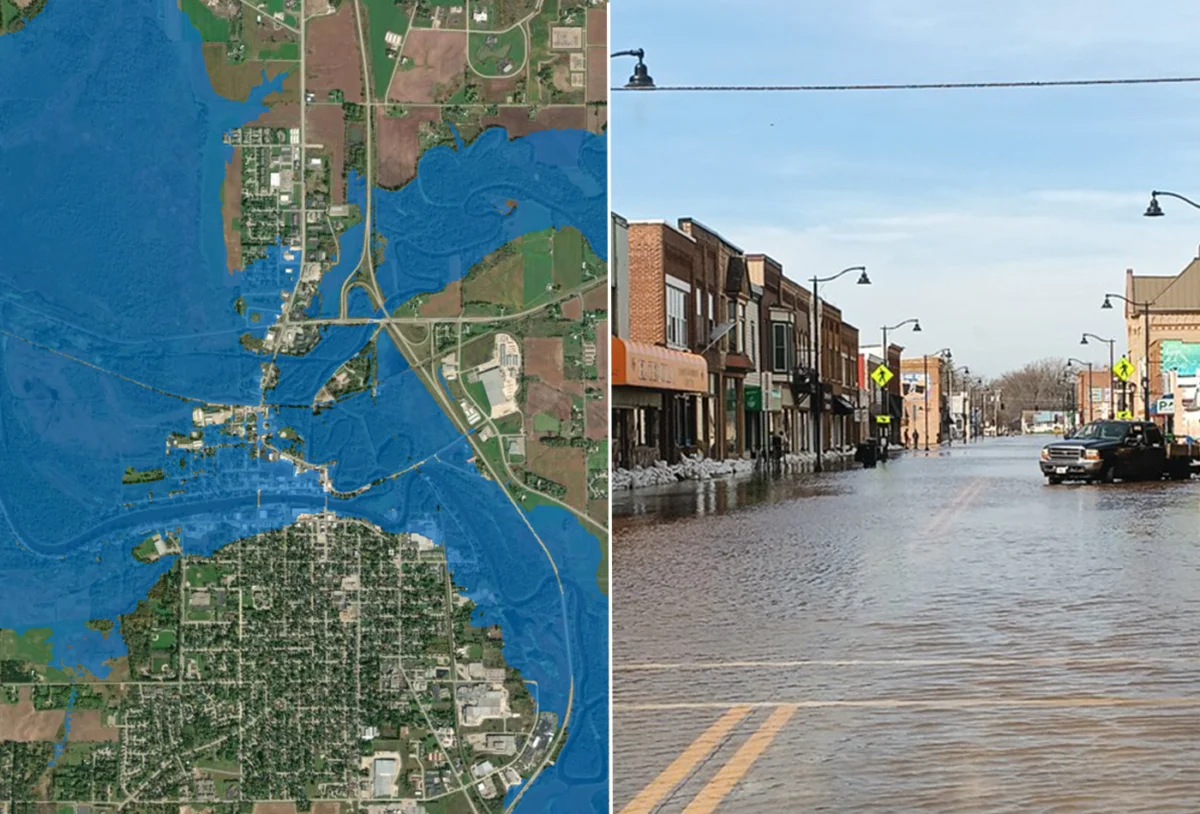
The FIM tool fundamentally alters this communication paradigm. By integrating high-resolution digital elevation models with real-time river flow data, the NWS can now project exactly where water will travel as it breaches riverbanks. This transition from abstract numbers to spatial visualization allows for more precise decision-making. If a road is predicted to be underwater, emergency managers can now see that blockage in real-time, allowing them to pre-position resources or issue targeted evacuation orders rather than relying on generalized county-wide alerts.
A Rapid Chronology of Implementation
The scale of this project is a testament to the rapid advancements in hydrological modeling and computational power. The rollout of FIM has been aggressive, designed to provide the most vulnerable populations with actionable data as quickly as possible.
- 2023 Launch: The initiative began with a limited scope, covering approximately 10 percent of the U.S. population. At this stage, the primary objective was to validate the accuracy of the models against historical flood events and refine the data integration processes.
- 2025 Expansion: By early 2025, the NWS successfully scaled the program to cover 60 percent of the country. This phase prioritized high-risk flood zones and densely populated areas where the potential for property damage and loss of life was greatest.
- Present Day: With the latest update, the coverage has reached 100 percent of the continental U.S., Hawaii, and Puerto Rico. This achievement brings a level of standardization to flood forecasting that was previously impossible, ensuring that a town in rural Nebraska has access to the same technological standard as a major metropolitan area like New York or Miami.
While the service now covers nearly the entirety of the nation, it remains a work in progress in certain remote or geographically complex areas. The current iteration does not yet provide full, high-resolution mapping for the northern and western portions of Alaska, nor does it cover Guam, the Northern Mariana Islands, or American Samoa. NOAA has indicated that these areas remain on the roadmap for future integration as data collection and modeling capabilities in those regions improve.
Supporting Data and Technical Framework
The FIM tool is not merely a static map; it is a dynamic, near-real-time engine supported by the Office of Water Prediction (OWP). The system operates by processing vast datasets from the National Water Model (NWM). The NWM simulates the movement of water across the landscape, accounting for soil moisture, snowmelt, precipitation, and urbanization.
When a river reaches a flood stage, the FIM tool overlays the predicted water levels onto high-resolution terrain maps. This allows users to toggle between different "flood scenarios." For example, an emergency manager can view what the inundation area looks like if a river reaches a "minor" flood stage versus a "major" flood stage. This granular control is essential for planning, as it accounts for varying levels of risk and helps to avoid "alarm fatigue" by providing specific, contextualized warnings.
The data is publicly accessible via the National Water Prediction Service website. It is also designed for interoperability; the NWS provides the data in multiple file types compatible with common Geographic Information System (GIS) applications. This is critical for local governments that maintain their own mapping software, as it allows them to layer the NWS flood data directly over their own utility, transportation, and emergency response maps.
Perspectives from Leadership
The expansion of FIM has been a cornerstone project for NOAA, championed by both the agency’s scientific leadership and its operations directors. NOAA Administrator Dr. Neil Jacobs emphasized that the goal was never just to produce better models, but to democratize access to life-saving information. "Inundation maps are a critical tool for assessing the impacts of flooding," Dr. Jacobs stated. "NOAA prioritized expanding FIM to ensure that nearly every American can access detailed information beyond the expected river crest height."
The sentiment is echoed by NWS Director Ken Graham, who has overseen the integration of these tools into the daily operations of National Weather Service field offices. "FIM has been a game changer when briefing emergency managers, first responders, and communities facing flood risk," Graham noted. According to Graham, the ability to show a first responder a map of their specific district—rather than an abstract hydrograph—drastically reduces the time required for decision-making during the critical hours before a flood peaks.
Broader Implications and Socio-Economic Impact
The implications of a nationwide flood mapping system are significant, particularly as climate patterns become increasingly volatile. Increased frequency of extreme precipitation events has made traditional historical flood data less reliable as a predictor for future risks. By relying on real-time modeling, the FIM tool provides a necessary buffer against the unpredictability of modern weather patterns.
Economic Resilience
The economic cost of flooding in the United States is staggering, often reaching billions of dollars annually in property damage, infrastructure repair, and lost productivity. By providing better intelligence, the FIM tool acts as an economic shield. Businesses located in flood-prone areas can use the data to move inventory to higher ground, while utility companies can preemptively shut down power to substations that are projected to be inundated, preventing long-term equipment damage and accelerating post-flood recovery.
The Human Element
Beyond the economic statistics, the primary objective of the NWS is the preservation of life. Flood-related fatalities frequently occur when individuals underestimate the depth or velocity of water on roads. A map that clearly illustrates that a road will be submerged serves as a powerful psychological and practical deterrent for motorists. Furthermore, the tool aids the public in understanding their personal risk, which may influence long-term decisions regarding flood insurance and home fortification.
Challenges and Future Considerations
While the achievement of 100 percent coverage is a major milestone, the efficacy of the tool remains dependent on the underlying input data. The accuracy of FIM is contingent upon high-quality topographic mapping. As terrain changes—due to urban development, erosion, or new infrastructure—the models must be constantly updated to remain accurate.
Additionally, the reliance on digital access poses a challenge for areas with poor broadband connectivity. As the NWS looks toward the future, the challenge will be to ensure that these sophisticated maps are easily interpretable and accessible even during the power outages and communication failures that often accompany severe weather.
The expansion of the Flood Inundation Mapping tool marks the conclusion of a multi-year effort to modernize the nation’s water intelligence. By bridging the gap between scientific modeling and public comprehension, the National Weather Service has established a new standard for disaster preparedness. As these tools continue to evolve, they will likely become the foundational component of how communities across the United States anticipate, plan for, and recover from the increasingly complex threat of riverine flooding.