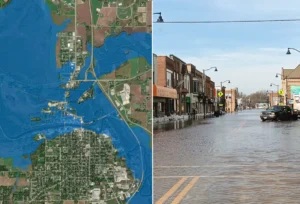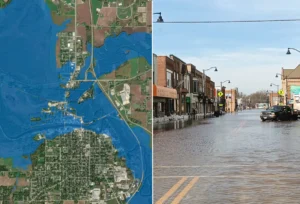
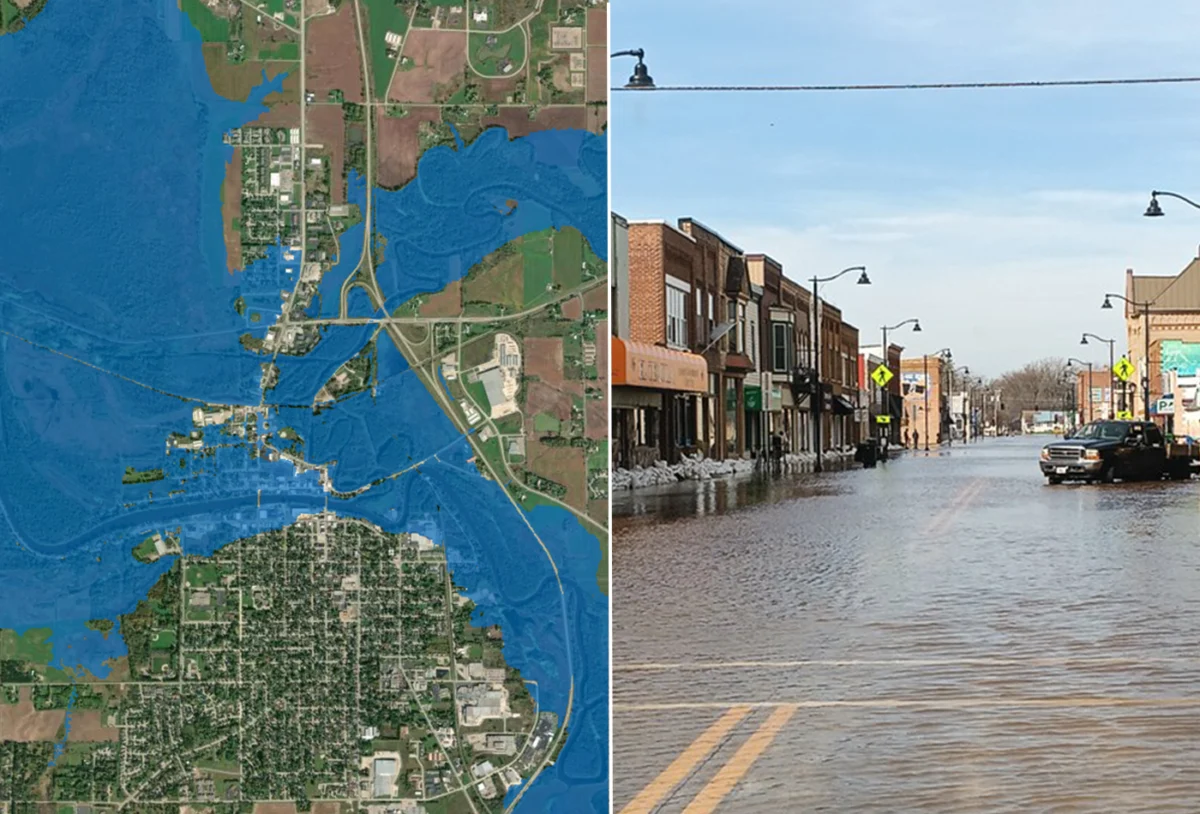
The National Oceanic and Atmospheric Administration’s (NOAA) National Weather Service (NWS) has reached a significant milestone in national disaster preparedness, announcing today that its Flood Inundation Mapping (FIM) tool now covers 100% of the contiguous United States, Hawaii, and several U.S. territories. This achievement marks the culmination of a multi-year effort to move beyond simple river-crest reporting to a sophisticated, visual, and neighborhood-level predictive system that identifies precisely which properties, roads, and infrastructure are at risk during flooding events.
By integrating model-forecasted river flows with high-resolution terrain data, the FIM system generates dynamic maps that visualize the extent of water coverage across 3.3 million river miles. This transition from abstract numbers—such as a projected river stage of 14.5 feet—to tangible, geospatial maps represents a paradigm shift in how emergency managers and the general public interpret flood threats.
A Chronology of Technological Evolution
The development of the FIM tool is part of a broader push by the Office of Water Prediction (OWP) to modernize hydrologic forecasting in an era of increasing extreme weather events. The initiative has seen rapid acceleration over the past two years:
- 2023 Launch: The program officially debuted, initially covering approximately 10% of the U.S. population. At this stage, the technology was largely experimental, focusing on high-risk river basins where data density was highest.
- 2025 Milestone: Through iterative data refinement and the deployment of new computing clusters, coverage expanded significantly to reach 60% of the nation. This period allowed for extensive stress testing of the models against real-world flooding events in the Midwest and the Gulf Coast.
- 2026 Expansion: The latest update brings the tool to its current, near-total capacity. By incorporating the southeastern U.S. coast, the Great Lakes, New England, the Rocky Mountains, and the Dakotas, NOAA has ensured that virtually every major watershed in the continental U.S. is now mapped.
While the coverage is now considered "nationwide," officials note that certain remote regions—specifically northern and western Alaska, Guam, the Northern Mariana Islands, and American Samoa—remain outside the current scope. These areas present unique geographical and data-gathering challenges, including sparse infrastructure and complex terrain that require more robust ground-level hydrological modeling before they can be integrated into the automated system.
The Science of Inundation: How the Tool Functions
At its core, the FIM tool functions as an interpretive layer for the NWS’s National Water Model. Traditionally, flood forecasts were delivered as text-based bulletins indicating whether a river would exceed "action," "minor," "moderate," or "major" flood stages. While useful for professionals, these figures often failed to communicate the localized impact to a homeowner or a local government official.
The FIM system changes this by using a "digital twin" approach. It combines near-real-time atmospheric and streamflow data with high-resolution digital elevation models (DEMs). When the model predicts a specific discharge rate at a USGS gauging station, the FIM system translates that flow volume into a surface map showing the estimated inundation footprint. This allows a user to see if their specific street, a local school, or a critical utility substation is likely to be submerged in the coming days.
For emergency management professionals, this information is vital for logistical planning. Knowing that a road will be under two feet of water at a specific time allows first responders to preposition resources, identify evacuation routes that will remain clear, and determine which neighborhoods may be cut off from emergency services.
Official Perspectives and Strategic Importance
The implications of this rollout have drawn praise from across the federal disaster management landscape. Dr. Neil Jacobs, NOAA Administrator, highlighted the democratization of flood data as the project’s most significant achievement. "Inundation maps are a critical tool for assessing the impacts of flooding," Dr. Jacobs stated. "NOAA prioritized expanding FIM to ensure that nearly every American can access detailed information beyond the expected river crest height. We are moving toward a future where flood risk is not a guessing game, but a mapped reality."
Ken Graham, Director of the National Weather Service, echoed these sentiments, emphasizing the tool’s utility in high-stakes environments. "FIM has been a game changer when briefing emergency managers, first responders, and communities facing flood risk," Graham noted. By removing the guesswork from flood forecasting, the NWS believes it can significantly reduce the "lead-time gap"—the period between receiving a warning and taking decisive action.
Industry analysts and urban planners suggest that the availability of these maps will also influence long-term land-use policies. By identifying chronic flood zones with greater precision, municipal planners can better inform zoning decisions, insurance risk assessments, and infrastructure investments.
Broader Impact on Disaster Resiliency
The expansion comes at a time when the frequency and intensity of inland flooding are becoming increasingly unpredictable due to changing climate patterns and urban development. The economic impact of flooding in the United States is substantial; the National Centers for Environmental Information (NCEI) has reported that flooding events are consistently among the costliest weather-related disasters, often resulting in billions of dollars in damage to residential and commercial property.
By providing free, publicly available data, NOAA is effectively lowering the barrier to entry for local governments that previously lacked the budget to commission their own private flood-risk studies. The maps are hosted on the National Water Prediction Service website and are compatible with various Geographic Information System (GIS) formats. This interoperability is key, as it allows local governments to overlay the NWS flood data with their own local datasets—such as the location of vulnerable populations or hazardous material storage sites.
Data Accessibility and Future Directions
The NWS has categorized the FIM services into different tiers to maximize utility for both the public and technical users. For the Lower 48 states and parts of south-central Alaska, four versions of FIM are provided in near-real time, ranging from deterministic forecasts to probabilistic estimates that account for forecast uncertainty. In Hawaii, Puerto Rico, and the U.S. Virgin Islands, the system provides specialized services tailored to the unique topography and flash-flood-prone nature of these environments.
Moving forward, the Office of Water Prediction has indicated that its primary goal is to address the "data desert" in the remaining non-covered regions. This will involve the deployment of new satellite-based sensing technologies and increased collaboration with international partners to gather the necessary hydrologic data for the Pacific territories.
Additionally, the NWS plans to increase the frequency of map updates. Currently, the system provides a significant look-ahead period, but as computational power continues to scale, the agency aims to move toward a more "live" streaming of flood data, which would allow for better tracking of rapidly evolving events like flash floods caused by atmospheric rivers or sudden convective storms.
Conclusion
The expansion of the Flood Inundation Mapping tool to 100% of the contiguous United States represents a monumental leap in the federal government’s ability to protect lives and property. By transitioning from historical crest data to predictive, neighborhood-level mapping, the National Weather Service has provided the public with an essential resource for navigating the increasing risks of a volatile climate. As these maps become integrated into the daily operations of emergency services and the decision-making processes of the general public, the national capability for flood response and recovery is expected to undergo a profound and positive transformation.