
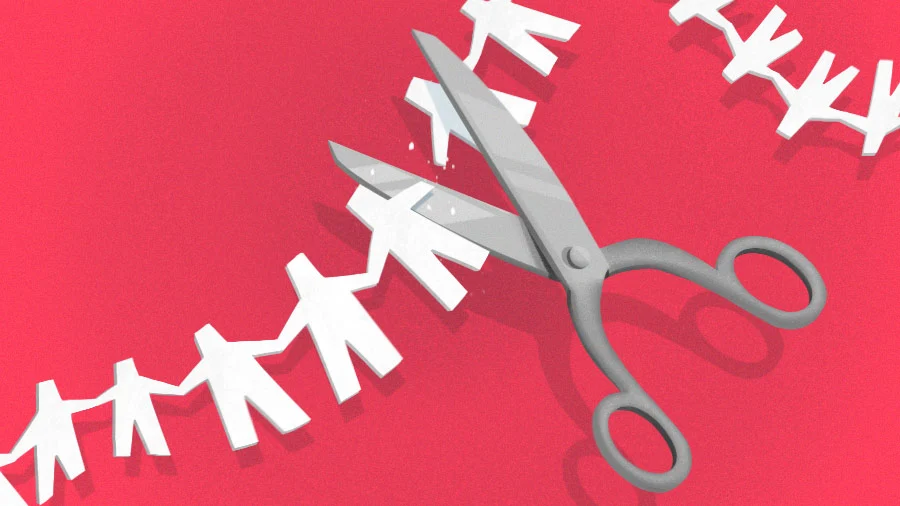
As the third quarter of 2026 draws to a close, the U.S. technology sector is grappling with a fresh wave of workforce reductions that underscores a persistent climate of corporate restructuring. According to recent data, at least 2,400 tech workers across the United States have been impacted by layoff notices or formal termination announcements within the final weeks of September. This latest surge in reductions highlights that despite earlier hopes for a stabilization of the labor market, major industry players remain committed to aggressive cost-optimization strategies.
The current round of layoffs is headlined by Oracle, which accounts for approximately 800 of the documented job cuts. The Austin-based enterprise software giant is executing a targeted reduction across multiple regions, including 359 positions in Washington state—impacting both its Seattle-area office and remote staff—and another 441 roles in California. These cuts reflect a broader trend of large-scale enterprises trimming headcount to refocus capital on high-growth areas, particularly artificial intelligence and cloud infrastructure.
Microsoft has also returned to the headlines, confirming a new round of workforce adjustments totaling approximately 500 positions. The reductions include 268 roles within the company’s Xbox gaming division, with additional cuts occurring across its Cloud + AI units. Because Microsoft is a global entity, the exact number of U.S.-based employees affected remains subject to clarification, but the scale of the reduction signals ongoing realignment within the tech giant’s core business segments.
Further compounding the industry’s contraction, Santa Clara-based Intel has reported the termination of 52 employees across four locations in its corporate headquarters city. While numerically smaller than the reductions at Oracle or Microsoft, the Intel cuts serve as a barometer for the semiconductor industry, which has faced significant volatility due to supply chain shifts and shifting demand for specialized computing hardware.
In the entertainment and media space, The Walt Disney Co. has pared its workforce by approximately 300 employees within its human resources and technology divisions. These layoffs coincide with the expiration of a voluntary early retirement incentive program, suggesting that the company is transitioning from a period of attrition-based downsizing to more direct, involuntary workforce management. Additionally, the startup sector has seen its share of instability, marked by the total shutdown of Oakland-based cap table management platform Pulley, which is set to cease operations effective December 8, 2026.
A Multi-Year Retrospective on Tech Industry Downsizing
To understand the severity of the current climate, it is necessary to examine the trajectory of the tech labor market over the past five years. The industry experienced an unprecedented hiring boom between 2019 and 2022, fueled by the rapid digitization of the global economy during the COVID-19 pandemic. As demand for e-commerce, cloud services, and digital collaboration tools spiked, companies like Alphabet, Amazon, and Salesforce expanded their workforces at an aggressive clip, often doubling headcount within a two-year window.
However, the correction that began in 2022 signaled a pivot toward fiscal discipline. In 2022, the industry saw more than 93,000 jobs slashed across public and private firms. That number surged in 2023, with over 191,000 workers displaced as companies grappled with rising interest rates and cooling venture capital markets. By 2024, the pace of layoffs showed early signs of moderation, with roughly 95,667 reported cuts. The year 2025 saw a renewed wave of instability, with approximately 127,000 workers let go. As of late 2026, the cumulative impact of these reductions has fundamentally altered the career landscape for thousands of engineering, product, and administrative professionals.
The Rationale Behind Persistent Reductions
Industry analysts point to three primary drivers behind the ongoing layoff cycle. First is the "post-pandemic hangover," where companies that over-hired to meet short-term surges in consumer demand found themselves overstaffed as market conditions normalized.
Second, the shift in venture capital focus has forced many startups to prioritize the "path to profitability" over rapid user acquisition. With funding rounds becoming more competitive and valuation multiples compressing, venture-backed companies are under immense pressure to extend their cash runways. For many, this has meant prioritizing the retention of core engineering talent while significantly cutting roles in marketing, recruiting, and human resources.
Third, the integration of generative AI has begun to reshape operational needs. Large tech employers have cited the need to reallocate resources toward AI-driven initiatives as a primary driver for recent cuts. By streamlining traditional software roles and non-core administrative functions, companies aim to free up the budget necessary to invest in specialized AI infrastructure and high-level research and development.
Broader Economic Implications and Labor Trends
The cumulative effect of these layoffs has introduced a new level of caution among the remaining tech workforce. While large companies continue to hire for specific roles—particularly in cybersecurity, machine learning, and cloud architecture—the overall hiring sentiment has become significantly more selective.
For employees, the current environment has shifted the focus toward job security and transferable skill sets. Many of those impacted by the 2026 layoffs are finding that the market for generalist roles has tightened, while demand for niche technical expertise remains resilient. Furthermore, the frequency of these announcements has led to an increase in transparency, with companies now utilizing more standardized protocols for reporting RIFs (Reduction in Force) to comply with the Worker Adjustment and Retraining Notification (WARN) Act in the U.S.
Methodological Notes on Market Tracking
The tracking of these figures involves the aggregation of media reports, regulatory filings, social media discourse, and crowdsourced databases such as layoffs.fyi. Because many private companies and smaller startups do not disclose specific numbers, these figures are viewed as conservative estimates. The tracker includes both public and private U.S.-based companies, as well as foreign entities with a significant domestic presence, such as Klarna. In cases where headcount reductions are not explicitly verified, they are classified as "unclear" to maintain the integrity of the data set.
Looking Ahead: What to Expect in 2027
Experts monitoring the sector suggest that while the "mass layoff" events of 2023 may be largely behind us, a steady stream of "surgical" layoffs is likely to persist through 2027. Companies remain sensitive to economic headwinds, including inflationary pressure and the potential for shifts in global trade policy.
For startups, the environment remains particularly precarious. Early-stage firms that are unable to demonstrate a clear path to profitability or secure follow-on funding in the current interest rate environment will likely face the same fate as those currently shutting down. As the year concludes, the tech industry appears to be moving toward a leaner, more efficiency-focused model. While the human cost of these transitions remains significant, the companies themselves are positioning for a long-term future where operating margins are as critical as product innovation.
The resilience of the U.S. tech sector will ultimately be tested by its ability to pivot toward sustainable growth. As these organizations continue to shed excess weight, the focus will likely shift to how they integrate new technologies into their streamlined workflows. For the thousands of workers caught in the current cycle, the current reality is one of volatility, requiring adaptability in a job market that no longer prioritizes the hyper-growth ethos of the early 2020s.