

The cryptocurrency market is currently navigating a complex juncture following a powerful summer rally that saw Bitcoin surge from sub-$65,000 levels in mid-August to peaks exceeding $82,000 within a matter of weeks. As the asset trades near the $77,100 threshold, market participants are weighing conflicting signals: robust underlying network health against mounting technical resistance, heavy distribution from long-term investors, and a shifting tide in institutional exchange-traded fund (ETF) flows.
While on-chain analytics firm CryptoQuant characterizes the broader macro trend as fundamentally constructive, digital asset analysts emphasize that bulls must conquer a dense cluster of technical and on-chain barriers before the asset can resume its upward trajectory. The interplay between historical profit-taking, shifting institutional sentiment, and key moving averages will likely dictate Bitcoin’s trajectory through the final quarter of the year.
The Anatomy of the Current Price Stall
Bitcoin’s recent momentum hit a hard ceiling after its rapid ascent breached the $82,000 mark. The subsequent retracement brought the asset down to approximately $77,100, where it now encounters a formidable convergence of technical hurdles. At the heart of this resistance is a heavy supply zone generated by long-term holders—investors who acquired their coins during earlier market cycles and are now taking the opportunity to de-risk.
According to data compiled by CryptoQuant, this veteran cohort offloaded an estimated 539,000 BTC within a single 30-day window. The majority of these realizations occurred precisely within the $77,100 to $80,200 price corridor. Because spot prices are currently hovering at the lower end of this range, incoming market demand is being forced to absorb a massive wall of liquid supply before any meaningful push toward higher valuations can take place.
Market strategists point out that this supply zone functions as a psychological and structural test for buyers. Every failed attempt to break higher gives these legacy holders another window of opportunity to trim their exposure. Consequently, clearing this band requires persistent capital inflows rather than a sudden, fleeting speculative spike.
Key Technical Thresholds and Moving Averages
Navigating the current market landscape requires close attention to specific moving averages and valuation bands that serve as structural signposts for traders and institutional managers.

The most critical near-term technical gateway is the 365-day moving average, which currently sits at $81,700. This specific threshold previously acted as a rejection point during the early-September advance, halting Bitcoin’s momentum after its brush with $82,000. In CryptoQuant’s analytical framework, a decisive daily or weekly close above the 365-day moving average would not merely represent a temporary resistance break; it would serve as formal confirmation of a sustained bull-phase continuation.
Should the price manage to pierce the $81,700 level, buyers will immediately face subsequent overhead barriers:
- The Metcalfe Valuation Band ($83,600): This metric derives network-value estimates from active addresses, establishing a fundamental valuation ceiling that aligns closely with current trading ranges.
- The Trader Realized Price Upper Band ($88,700): Tracking the aggregate cost basis of active market participants, this band historically coincides with widening profit margins and heightened selling pressure as spot prices approach it.
Conversely, if selling pressure intensifies and forces a deeper correction, analysts are eyeing downside support zones. The first line of technical defense is the 200-day moving average, positioned near the $70,000 mark. A more robust accumulation cluster lies further down between $62,000 and $65,000, a range where approximately 476,000 BTC changed hands earlier in the year, forming a historically strong bedrock of support.
Institutional Sentiment Divergence: Bitcoin ETFs vs. Ether Products
While technical charts map out the price action, institutional capital flows via exchange-traded funds reveal a more nuanced sentiment among corporate treasuries and traditional wealth managers.
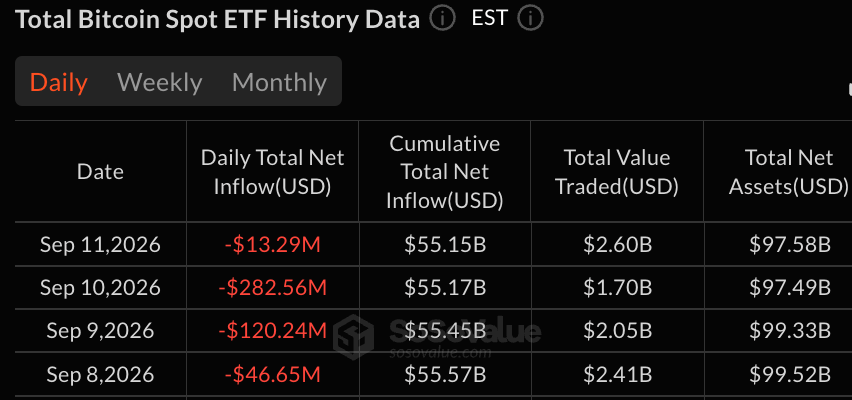
U.S. spot Bitcoin ETFs recently experienced a cooling-off period, posting $13.29 million in net withdrawals at the end of the trading week. This minor outflow capped a four-session negative streak that saw the group shed a cumulative $462.73 million. Despite these redemptions, total trading volume remained healthy at $2.60 billion, bringing aggregate net assets for the category to $97.58 billion.
Market observers note that while these fund outflows did not directly instigate the price retreat toward $77,000, they did highlight a distinct lack of aggressive institutional buying to absorb the overhead supply coming from long-term holders.
This behavior contrasts sharply with concurrent trends in alternative digital asset products. Ether-based ETFs, for instance, pulled in $216.41 million, successfully wrapping up a fourth consecutive week of net inflows. Although financial analysts caution against viewing this split as a direct asset rotation from Bitcoin to Ether, the divergence underscores a more selective approach among institutional allocators. Rather than maintaining a broad-brush exposure to the entire crypto sector, capital is increasingly being deployed based on asset-specific catalysts and relative valuations.
Macroeconomic Context and Market Implications
The current consolidation phase unfolds against a broader macroeconomic backdrop characterized by shifting expectations surrounding inflation data, monetary policy adjustments, and global liquidity trends. Recent Consumer Price Index (CPI) releases have provided mixed signals, leaving investors uncertain about the pace of future interest rate adjustments by major central banks. In environments marked by macroeconomic ambiguity, risk assets often experience heightened sensitivity to internal supply-and-demand dynamics.
For Bitcoin, the transition from a speculative recovery phase to a mature bull market hinges on its ability to digest historical supply. The distribution of over half a million coins by long-term holders demonstrates that older capital is actively recycling into the market. Historically, such distribution events are a natural prerequisite for a sustainable transfer of wealth from early adopters to new institutional and retail participants, ultimately laying the foundation for higher structural price floors over the medium to long term.
Outlook and Roadmap for Market Participants
As the market digests the competing pressures of overhead distribution and macro liquidity, the immediate roadmap for Bitcoin is well-defined by key structural milestones.
To shift the market structure back in favor of the bulls, buyers must accomplish the following sequential objectives:
- Absorb the $77,100 to $80,200 Supply Band: Ongoing demand must clear the residual coins being offered by long-term holders who acquired positions during previous market cycles.
- Secure a Daily/Weekly Close Above $81,700: Overcoming the 365-day moving average is essential to invalidate the recent bearish rejection patterns and confirm renewed upward momentum.
- Test the Metcalfe Valuation Ceiling at $83,600: Successfully navigating this network-activity threshold will open a clear path toward testing the upper limits of trader cost bases near $88,700.
Until these technical markers are decisively reclaimed, Bitcoin is expected to trade within a reactive range, balancing the strong long-term fundamentals highlighted by on-chain analysts against the immediate headwinds of institutional capital selectivity and veteran profit-taking.